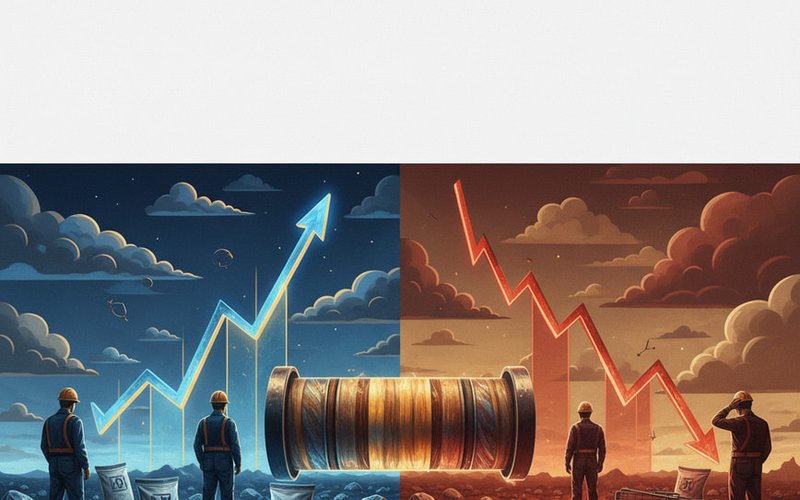
ASX:ALDEnergyOil & Gas Refining & Marketing
Ampol Ltd
$33.310
Day Range
$32.940 – $33.690
52 Week Range
$24.670 – $37.130
Volume
0.00
Avg Volume (10D)
1.15M
Market Cap
$7.94B
P/E Ratio
96.18
Price Chart
Market Statistics
Open$33.310
Previous Close$33.310
Day High$33.690
Day Low$32.940
52 Week High$37.130
52 Week Low$24.670
Valuation
Market Cap7.94B
Shares Outstanding238.30M
P/E Ratio (Annual)96.18
P/E Ratio (TTM)95.90
Dividend Yield3.02%
Price to Book2.60
Trading Activity
Volume0.00
Value Traded0.00
Bid$32.900 × 350
Ask$33.670 × 785
Performance
1 Day-0.60%
5 Day-9.03%
13 Week0.15%
52 Week27.73%
YTD3.85%
Technical Indicators
RSI (14)40.57
50-Day SMA$34.347
200-Day SMA$31.624
Latest News
Hot Topics
Market Wrap: Caution finally hits ASX to end three-week winning streak

Hot Topics
Market wrap: ASX setting up for a rebound rally?
Hot Topics
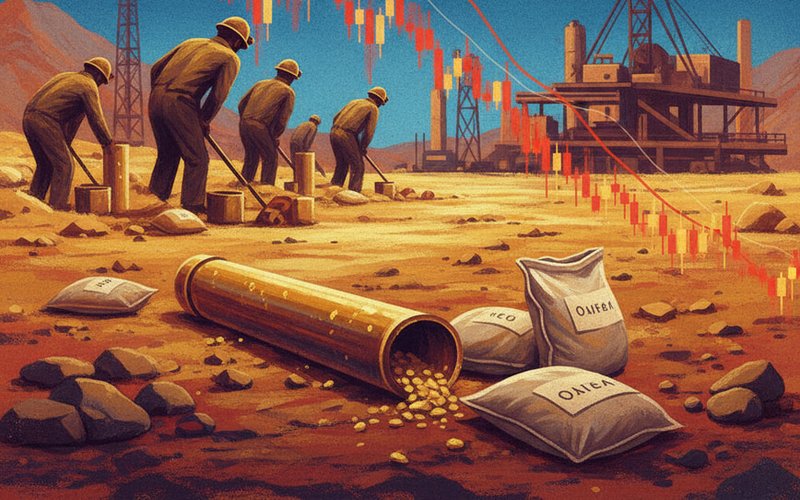
Market Wrap: Shares slide after damage to energy facilities
ASX slides after energy facilities damaged, fueling inflation fears; index down 0.8% to 8428.4 as rate hikes priced in, gold and mining stocks lead losses.

Hot Topics
Weekly Wrap: Shares fall another 2.6% for the week as conflict worsens
ASX 200 slides 2.6% this week to 8,617 as Iran-Israel conflict lifts oil above $100; NST and SYR plunge, while EOS soars on a Middle East contract.